With the holiday season upon us, we wanted to revisit one of our first R-Ladies Baltimore coding projects we did in 2018 where we got into small groups and created holiday data visualizations in R.
Example designs
Here are a few examples
Happy holidays
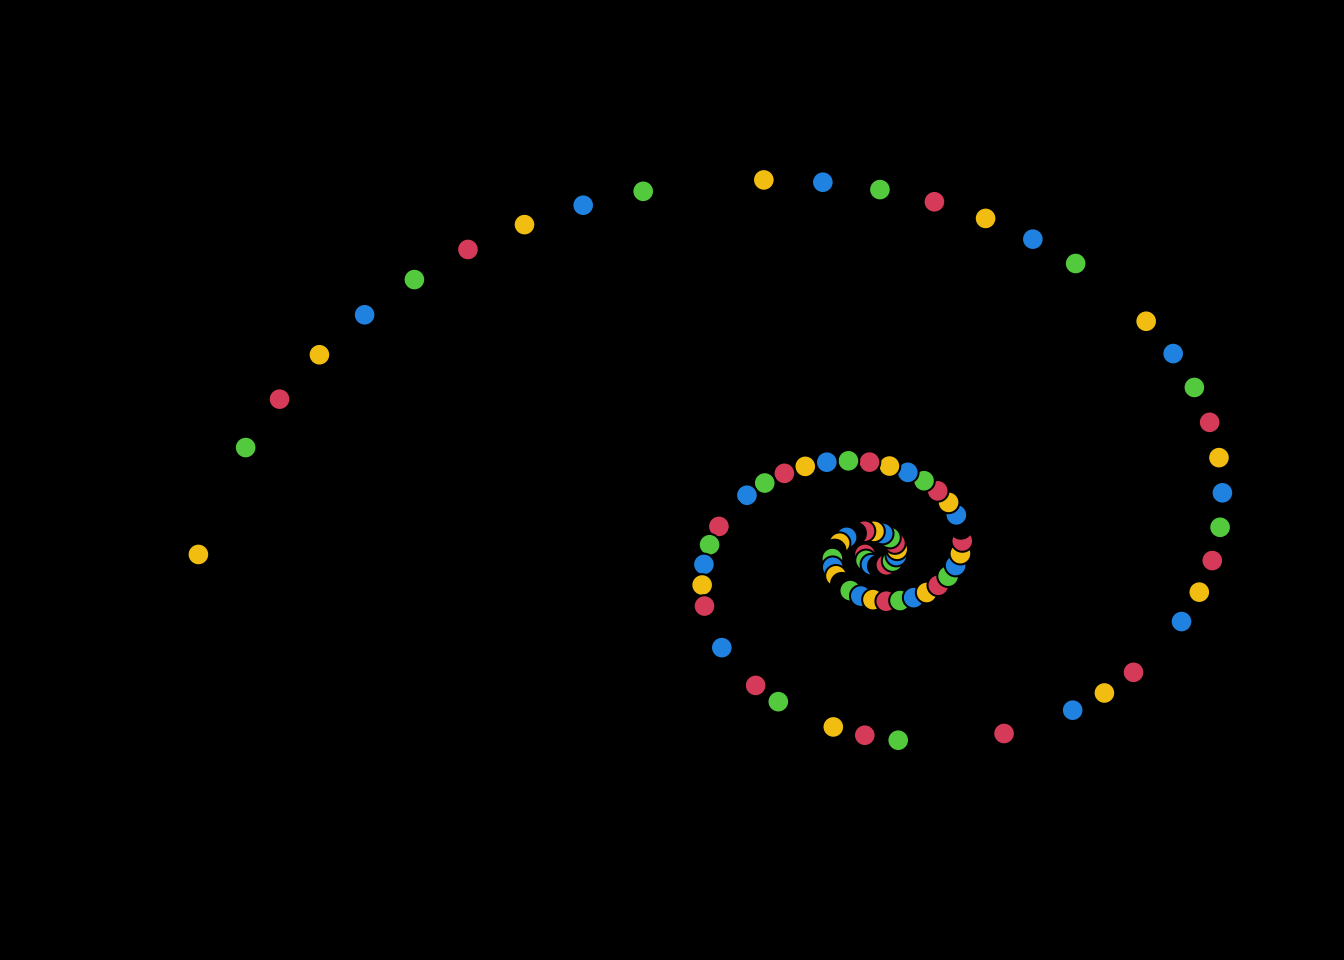
This is from Rafael Irizarry where the made part of the code is made in base R and looks liek this:
N <-120par(bg="black")h <-rep(c(2:4,7),N/3)h[sample(N,N/5)] <-0plot((-2)^as.complex(seq(1,49,len=100)^0.5),pch=21,bg=h,xlab="", ylab="", xaxt="n",yaxt="n", cex=1.5)text(-25,50,"Happy Holidays!",cex=2,col=ifelse(h%%2,"white","black"))
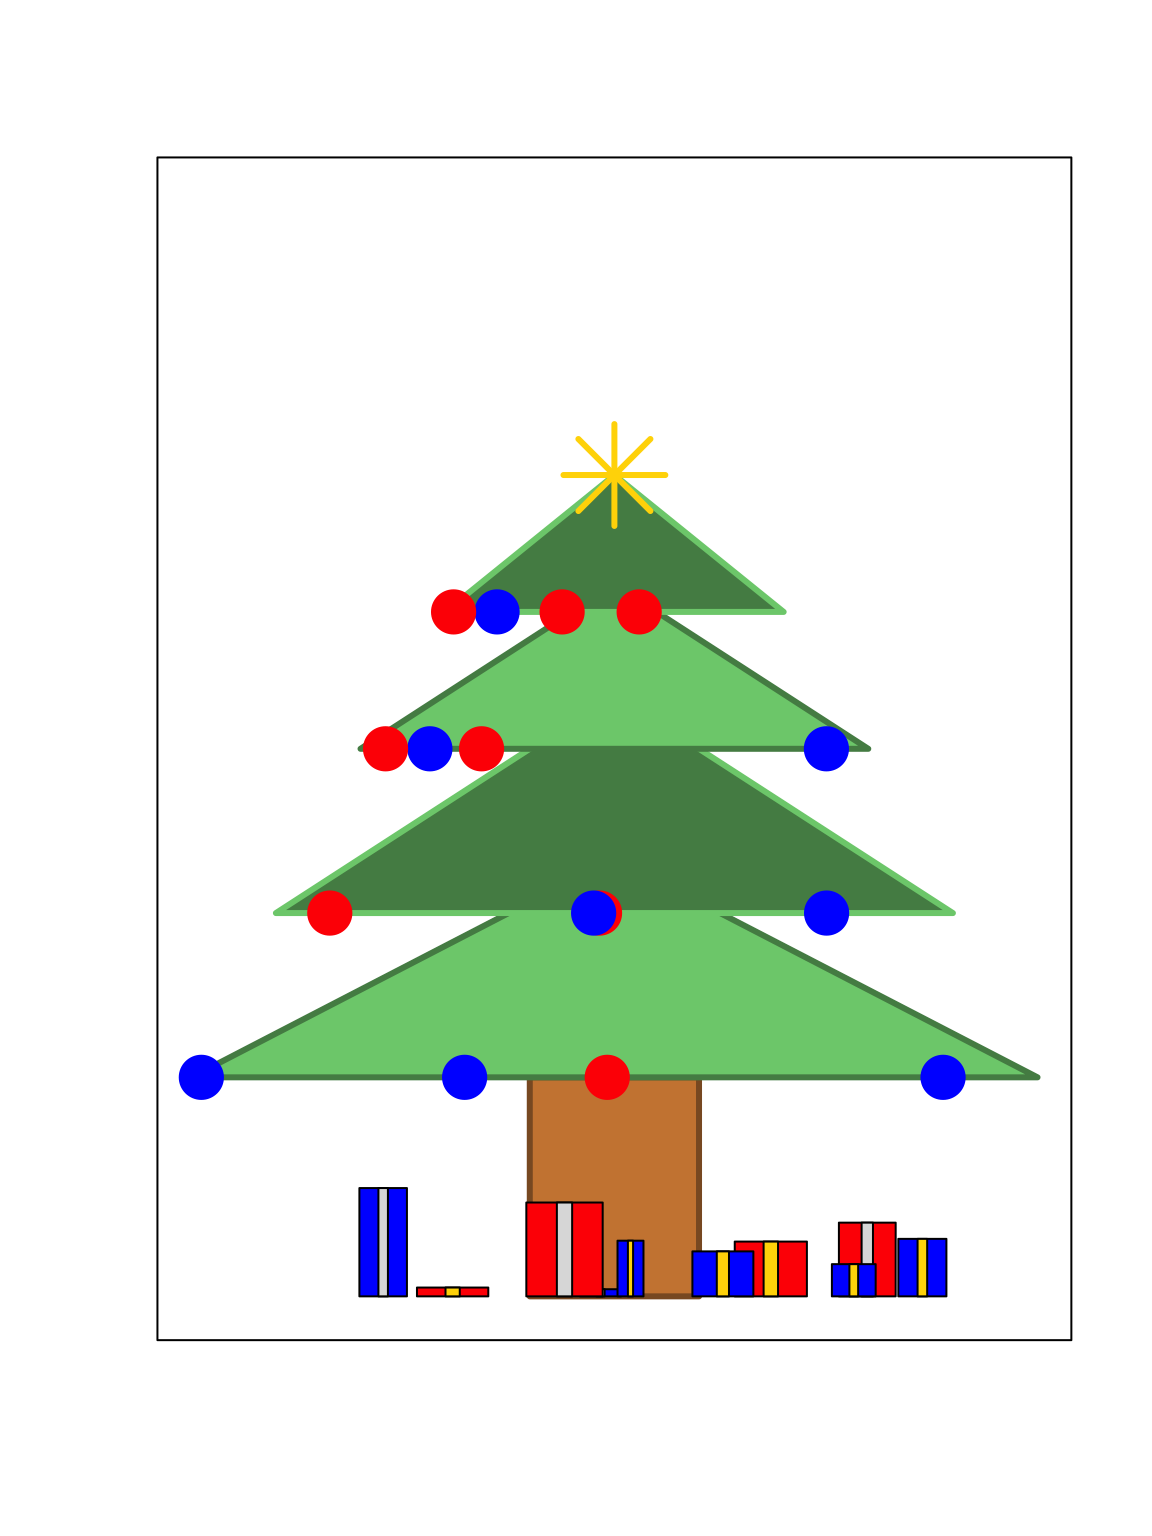
# Make the canvasplot(1:10,1:10,xlim=c(-5,5),ylim=c(0,10),type="n",xlab="",ylab="",xaxt="n",yaxt="n")# Make the branchesrect(-1,0,1,2,col="tan3",border="tan4",lwd=3)polygon(c(-5,0,5),c(2,4,2),col="palegreen3",border="palegreen4",lwd=3)polygon(c(-4,0,4),c(3.5,5.5,3.5),col="palegreen4",border="palegreen3",lwd=3)polygon(c(-3,0,3),c(5,6.5,5),col="palegreen3",border="palegreen4",lwd=3)polygon(c(-2,0,2),c(6.25,7.5,6.25),col="palegreen4",border="palegreen3",lwd=3)#Add some ornamentspoints(x=runif(4,-5,5),y=rep(2,4),col=sample(c("blue","red"),size=4,replace=T),cex=3,pch=19)points(x=runif(4,-4,4),y=rep(3.5,4),col=sample(c("blue","red"),size=4,replace=T),cex=3,pch=19)points(x=runif(4,-3,3),y=rep(5,4),col=sample(c("blue","red"),size=4,replace=T),cex=3,pch=19)points(x=runif(4,-2,2),y=rep(6.25,4),col=sample(c("blue","red"),size=4,replace=T),cex=3,pch=19)points(0,7.5,pch=8,cex=5,col="gold",lwd=3)# Add some presentsxPres =runif(10,-4.5,4.5)xWidth =runif(10,0.1,0.5)xHeight=runif(10,0,1)for(i in1:10){rect(xPres[i]-xWidth[i],0,xPres[i]+xWidth[i],xHeight[i],col=sample(c("blue","red"),size=1))rect(xPres[i]-0.2*xWidth[i],0,xPres[i]+0.2*xWidth[i],xHeight[i],col=sample(c("gold","grey87"),size=1))}
Trees in ggplot2
Here is another tree design as well, but made in ggplot2
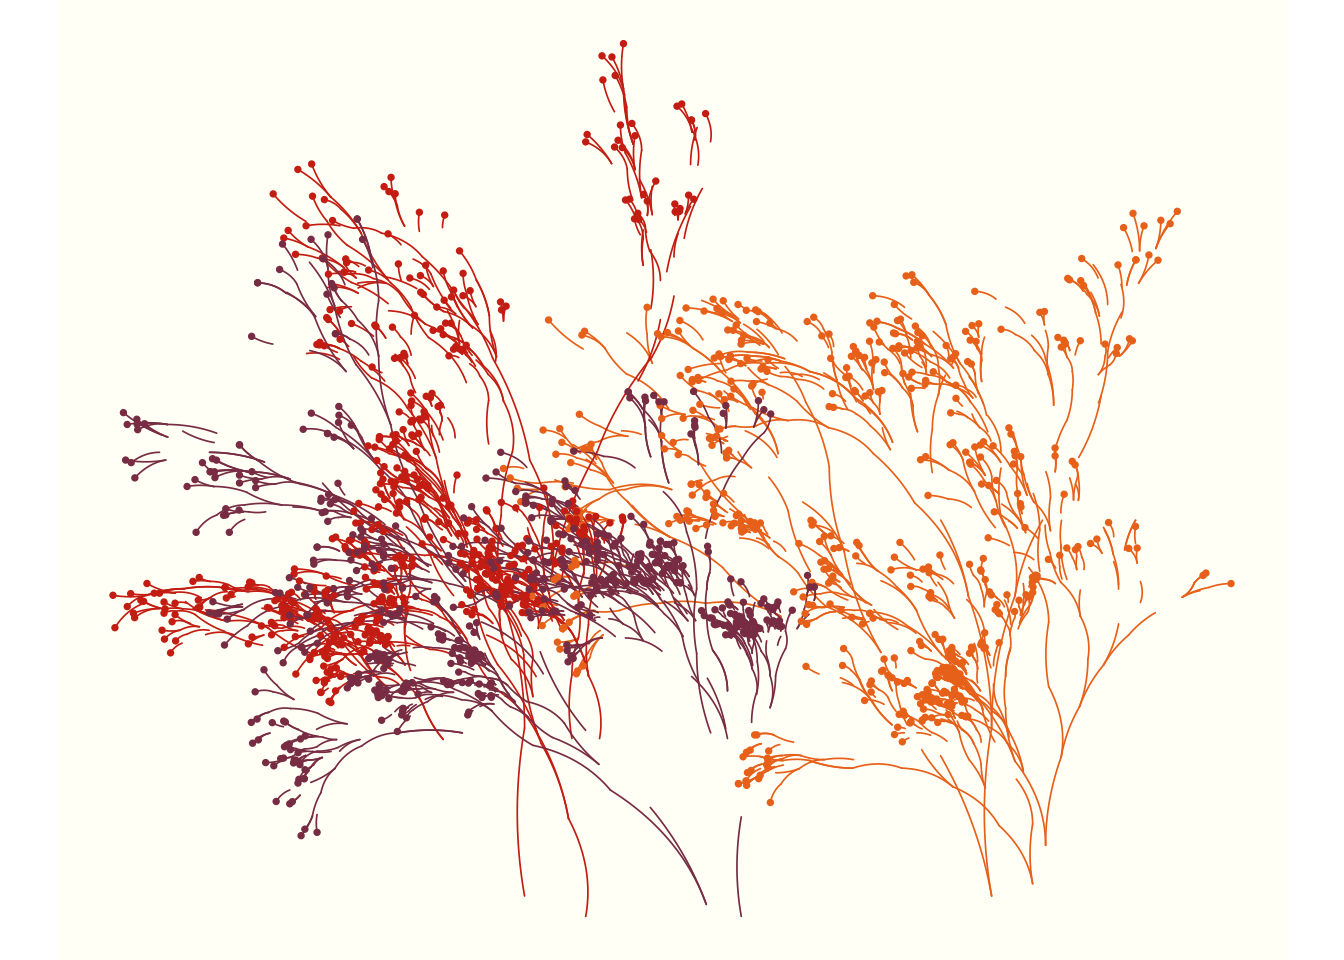
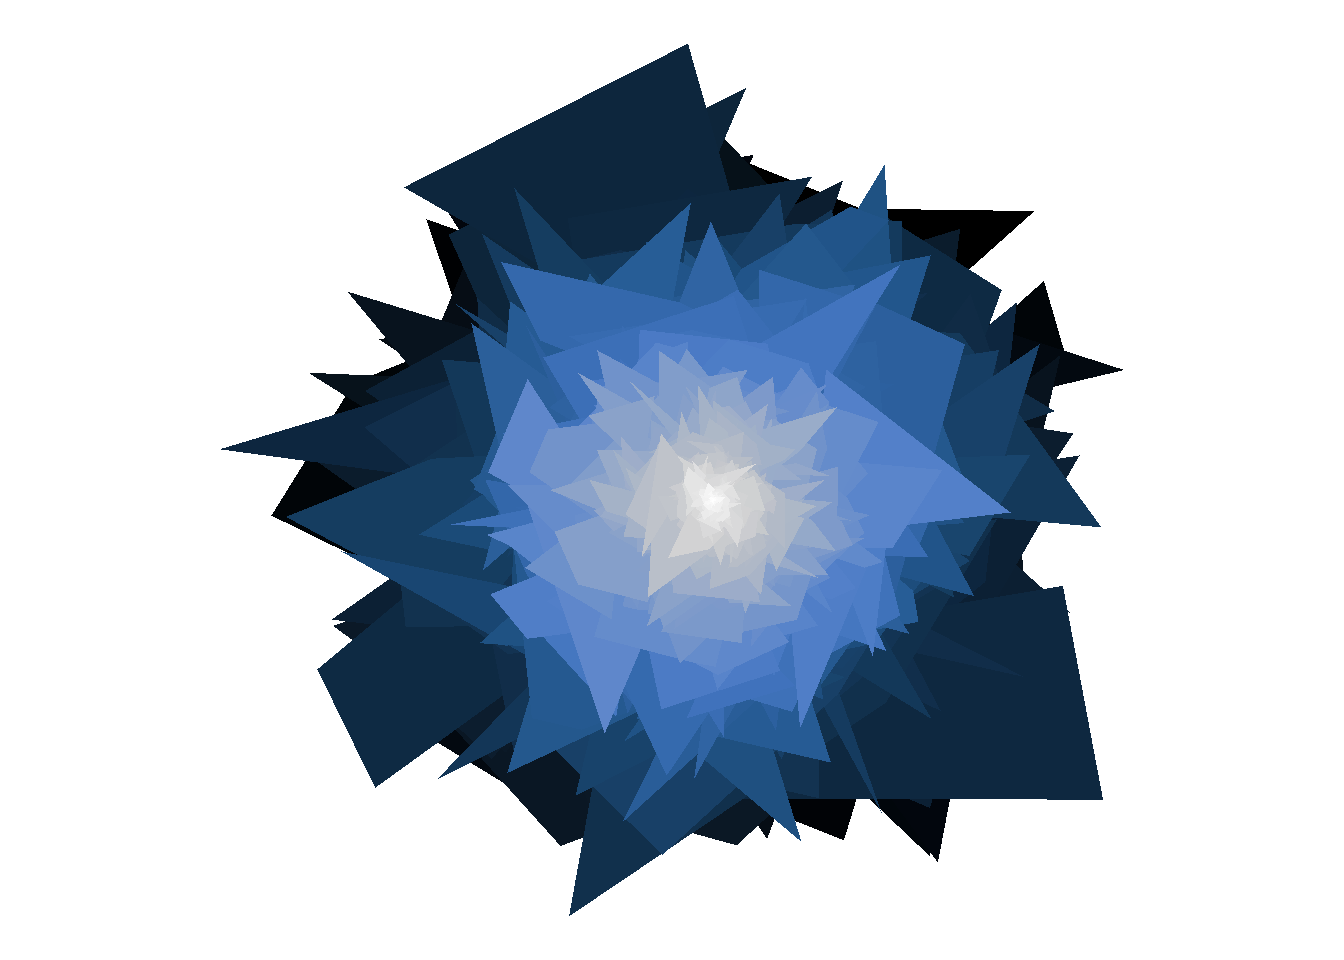
Generative art
Another fun option to explore is the use of generative art. For example, you can explore some of the following:
Introduce yourself to your neighbor and find a group of people that you want to work with
Open up R
Your group can either work through the code that’s provided (great for beginners in R!) or if you want to challenge yourself, create your own holiday design!
You can then use the image as a holiday design to send to your family and friends this holiday season. Around 4:30, we will start presentations and ask anyone who’s interested in discussing their design and talking through how they created it.
Submit code and images of holiday designs to the #meetup-events channel the R-Ladies Baltimore Slack.